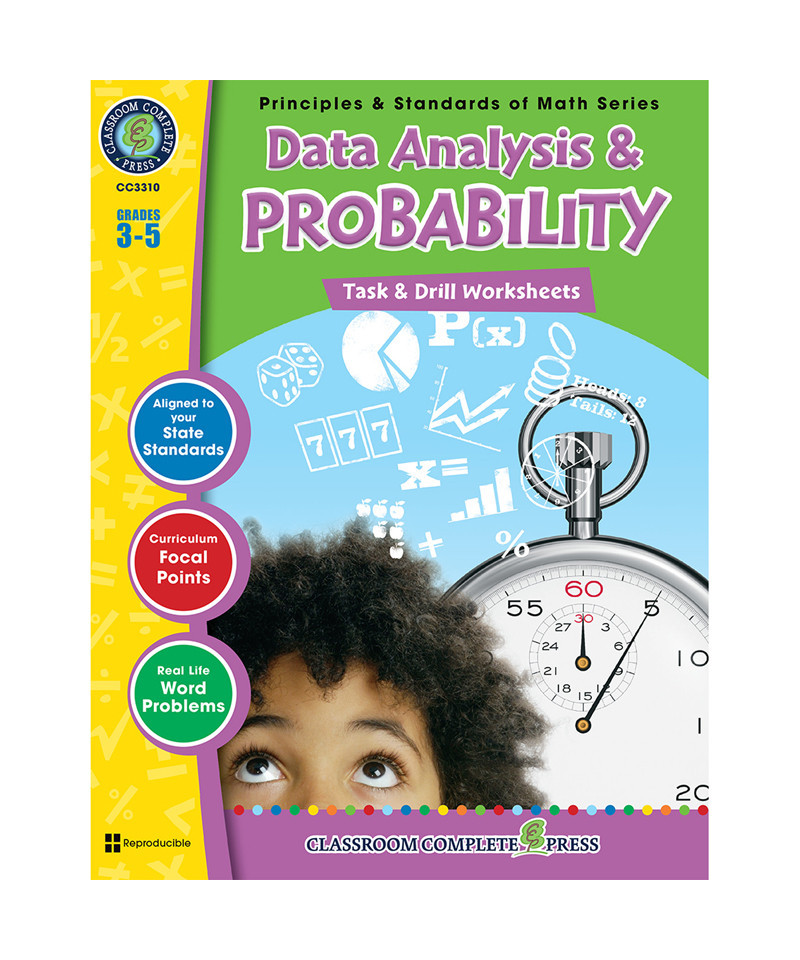
Create graphs using gathered information and accurately read the data to make predictions. Our resource introduces the mathematical concepts taken from real-life experiences, and provides warm-up and timed practice questions to strengthen procedural proficiency skills. Create circle graphs to match the fractions. Survey your class to find out what pizza they like best. Create a bar graph using information provided in a chart. Find the probability of rolling an even number on a standard die. Convert information gathered in a chart to probability statistics. Find the probability of choosing a green marble from a box. Calculate the percentage of students who signed up for the baseball team given the information. The task and drill sheets provide a leveled approach to learning, starting with grade 3 and increasing in difficulty to grade 5. Aligned to your State Standards and meeting the concepts addressed by the NCTM standards, reproducible task sheets, drill sheets, review and answer key are included.


